Pegasus asked:cards or a matrix?We designed both, and tested first.
Pegasus wanted travellers to compare fare bundles more easily, and to buy them. We designed a card layout and a matrix. I made the case to test both before choosing, then planned and ran the study. The faster layout turned out to be the less accurate one.
participants completed the study
chose the right bundle on cards
chose the right bundle on the matrix
confidence on the matrix, the highest of all
Compare bundles, and sell more of them
Pegasus came with a question, not a layout. Two more notes in the brief shaped everything that followed.
“To compare bundles, and to increase bundle sales: should it be cards, or a matrix?”
Travellers didn’t know what each service in a bundle meant. Could each have an explanation?
The doubt was in the brief from day one.
Brief from Pegasus’s product team, October 2025. Paraphrased.
How other products compare plans
Plan comparison is a solved problem in other industries. I looked at how subscription products and one airline lay out tiers on web and mobile: what they highlight, and how they explain each row.
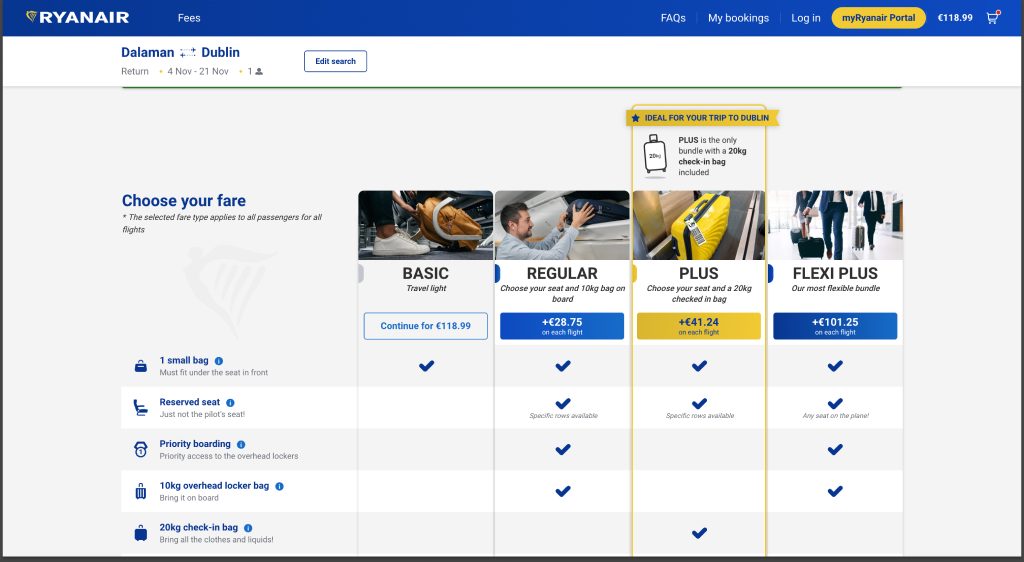
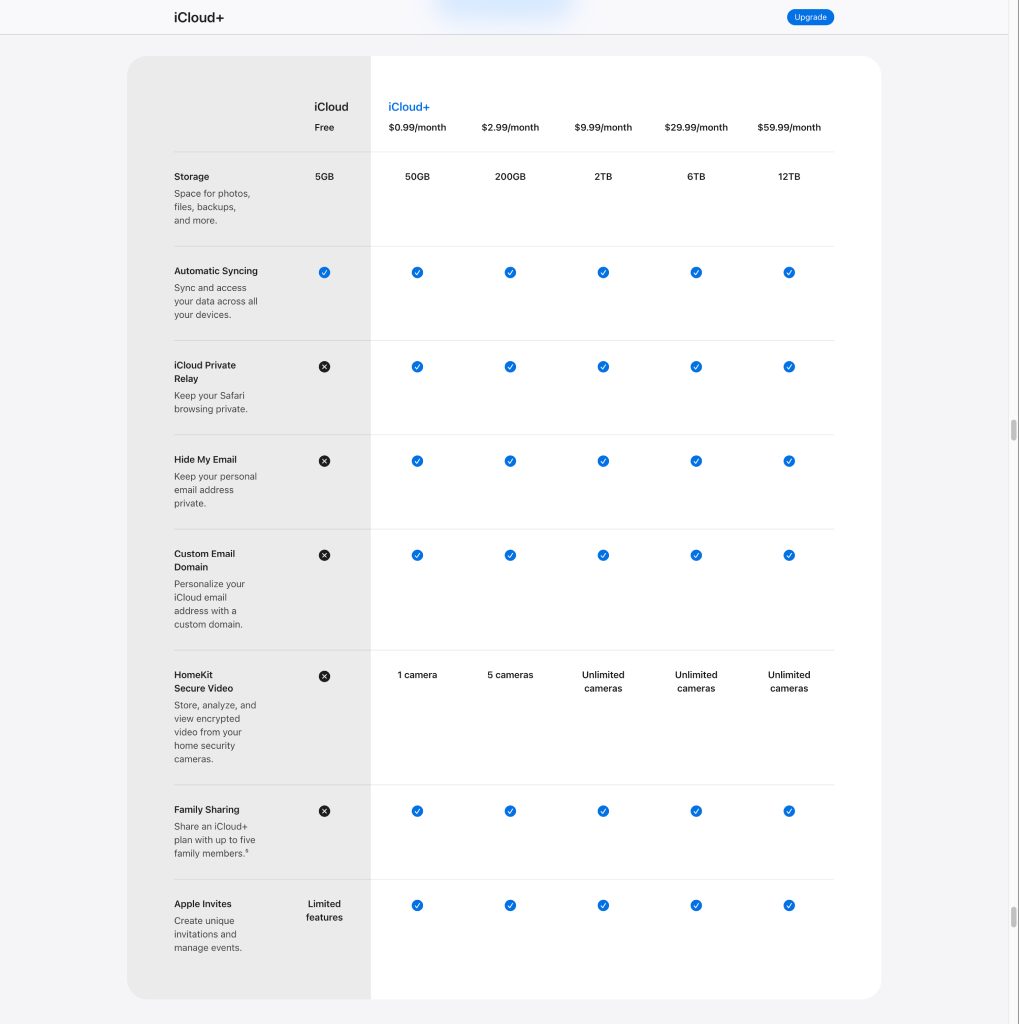
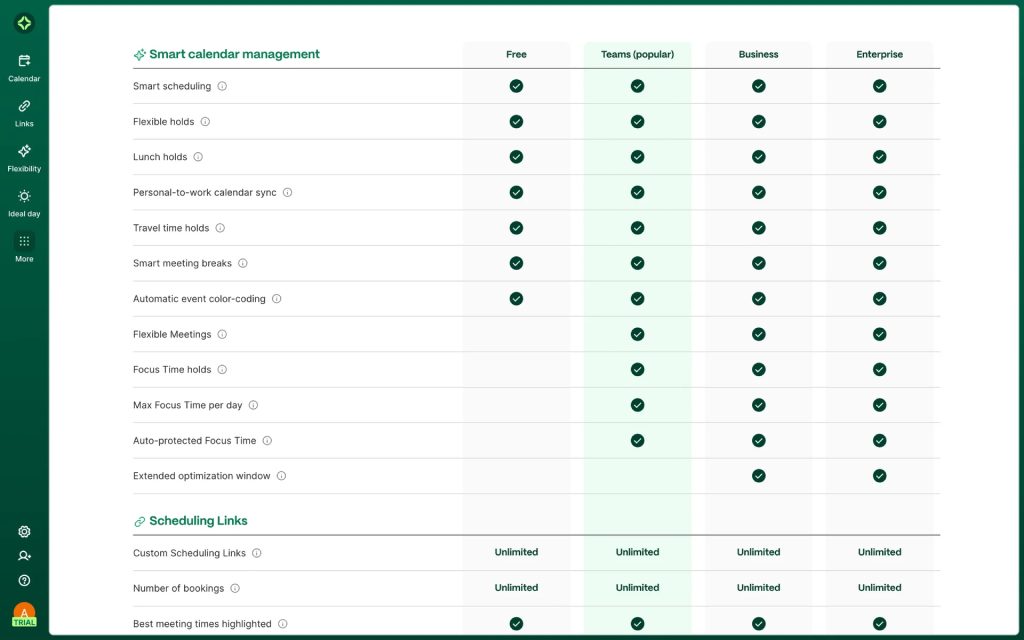
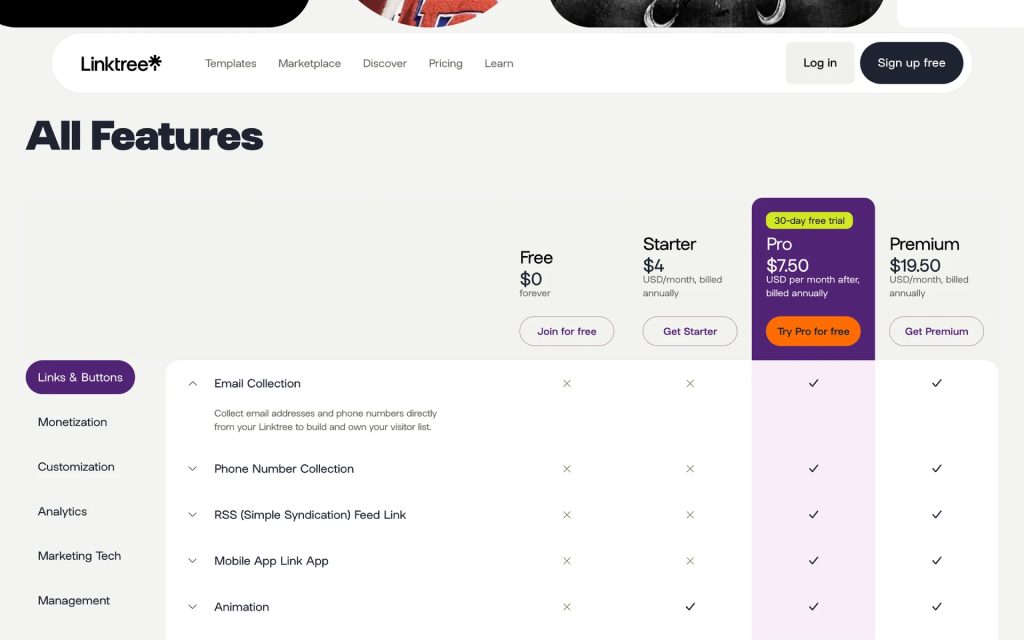
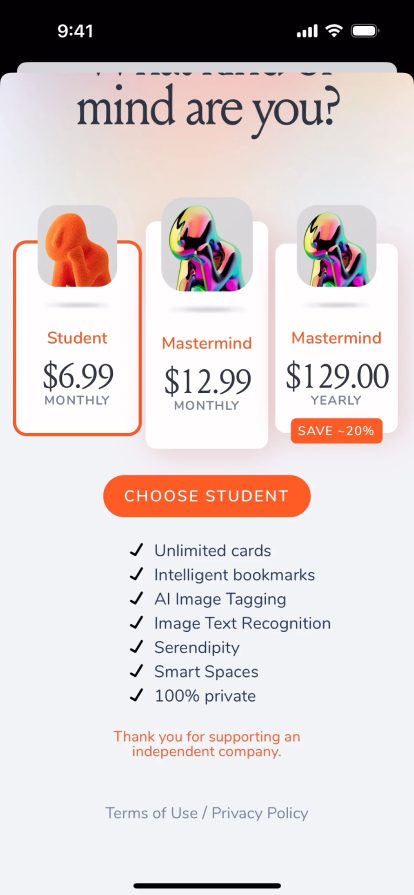
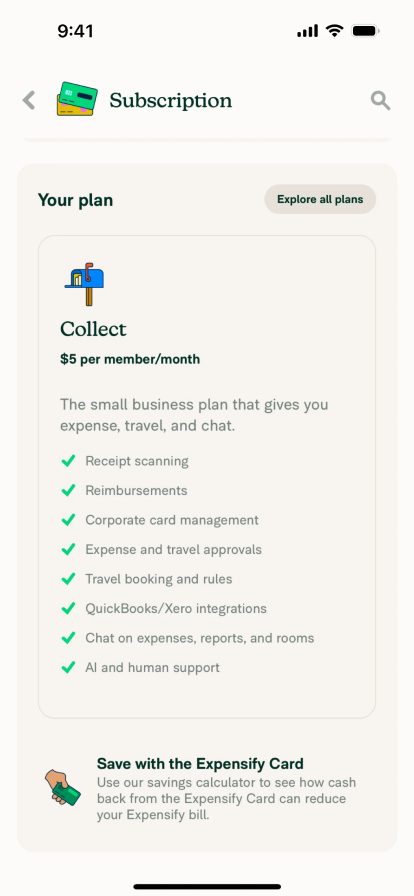
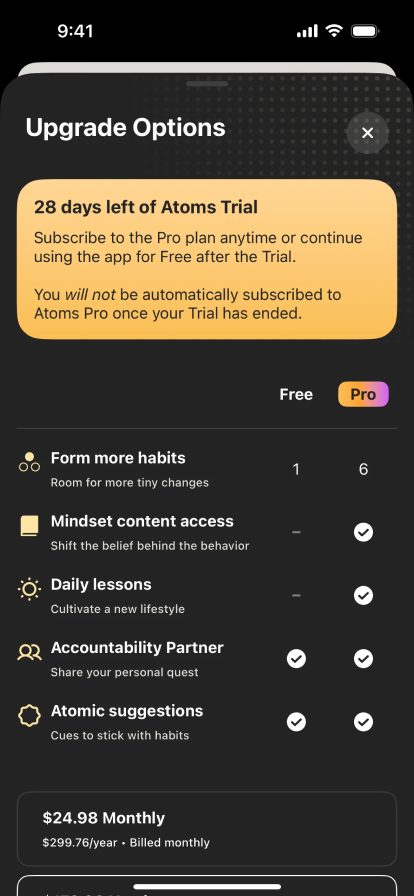
Plan comparison screens, mostly via Mobbin; Ryanair web, October 2025.
Two layouts, the same bundles
We designed several matrix alternatives and a card layout close to the live design. One matrix went into the test, next to the cards.
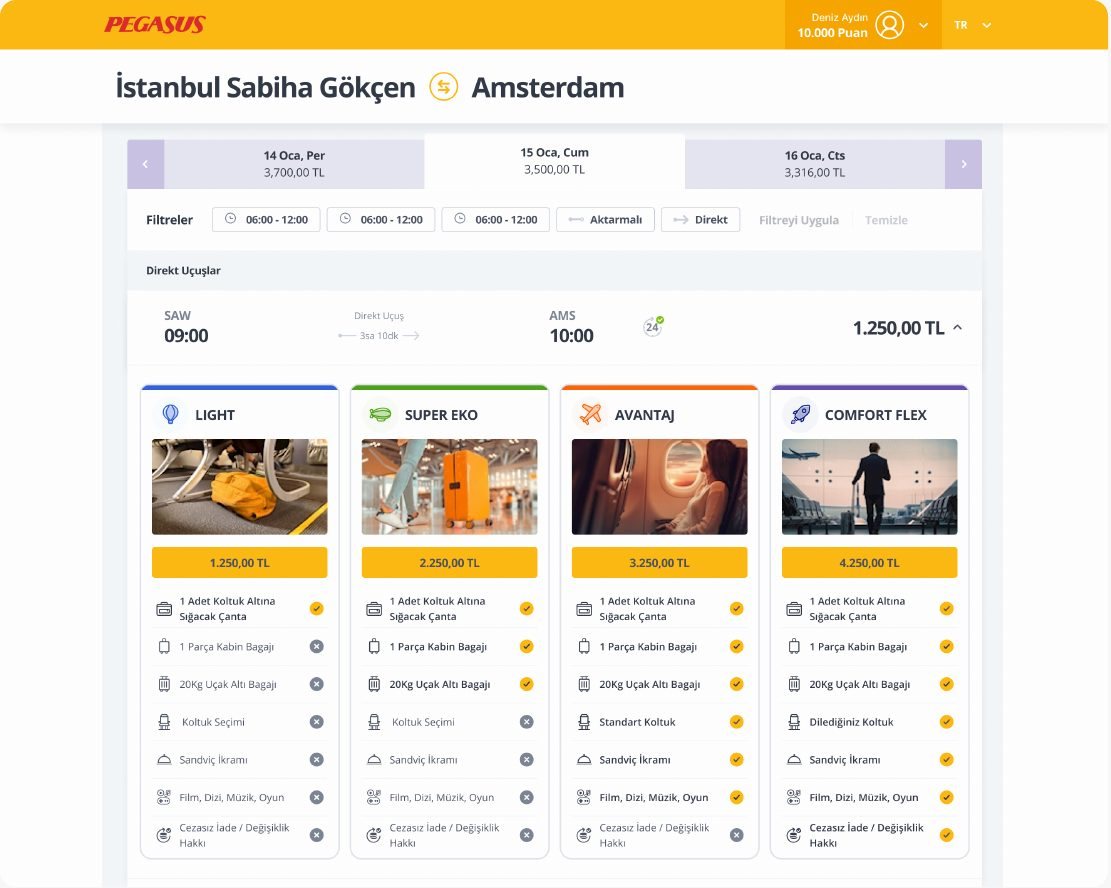
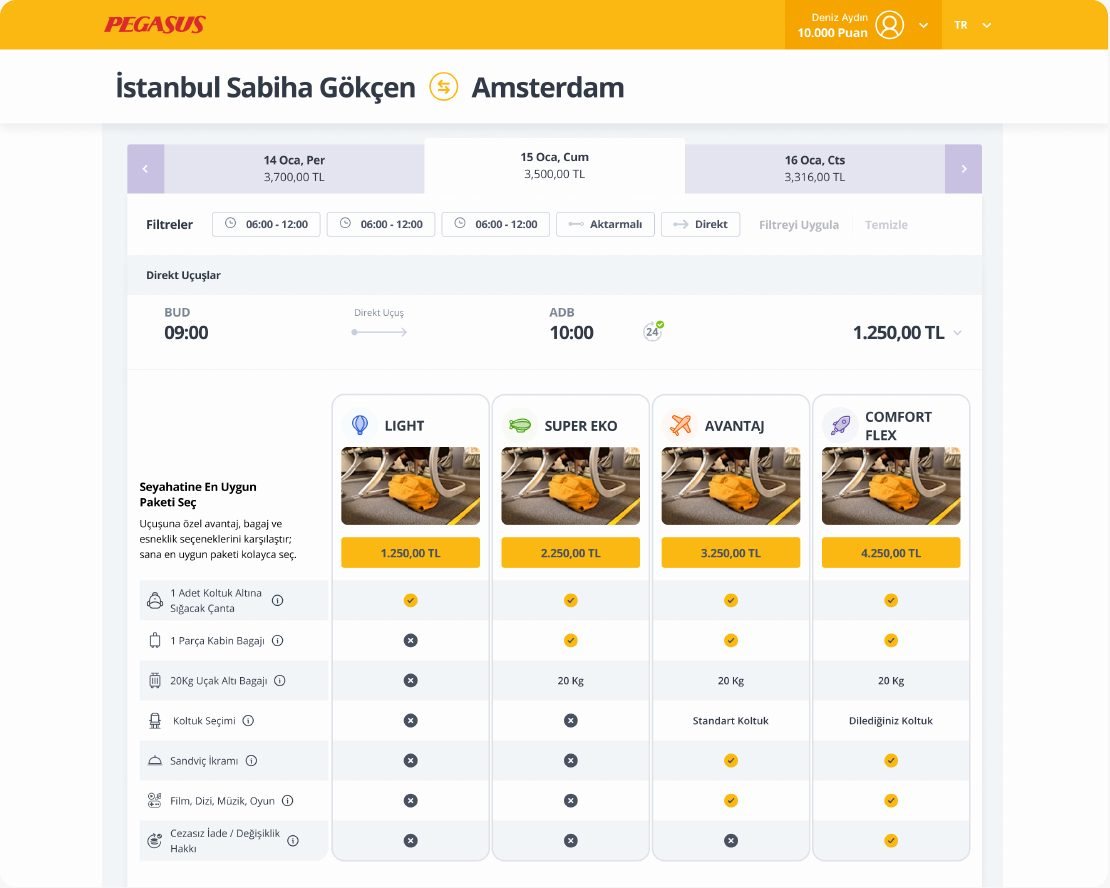
A bundle is a paid decision: pick the wrong one and you pay again for baggage or changes. I made the case to test both layouts against what matters here, choosing the right bundle, not only a fast one. The UX lead and Pegasus’s product owner approved the plan before launch.
A test both sides trusted
An unmoderated test on Maze, on desktop. Everyone did the same task on one layout, then looked at the other.
Flew at least twice in the last 12 months; on desktop.
First impression of the page.
“You need a 20 kg checked bag, Istanbul to Amsterdam. Pick a bundle.”
See the alternative, say which is clearer.
Preference, trust and confidence.
then the matrix
then the cards
Participants: flew Pegasus or another low-cost airline at least twice in 12 months; ages 20–45; Türkiye and Europe; UX professionals and travel agents excluded. 33 completed the study; some dropped out along the way for reasons the tool couldn’t show, so task-level totals differ slightly.
Faster isn’t always clearer
One dot per participant who reached the task.
Chose the correct bundle, one dot per participant
Speed
The matrix was faster to decide on, and less often right.
Confidence
Everyone felt sure. On the matrix, that confidence wasn’t earned.
Why the cards felt clearer
“It’s easier to tell them apart, and it minimises the chance of making a mistake.”
Participant · translated
“For older people, like my parents, the matrix is hard: you have to follow the bundle down to the row, or the row across to the column.”
Participant · translated
“The features are clearer. There’s less chance of mixing them up.”
Participant · translated
What both layouts got wrong
Most clicks missed
Around 70% misclicks on both: people clicked card bodies and table cells instead of the button. On the matrix, 4 of the 5 who dropped out mid-task never found it.
Nobody opened the details
Service icons and info buttons went almost untouched, even while people asked “is baggage included?”.
Price led the scan
With the price on top, some people chose before reading the services. An observation, not measured directly.
What we recommended
I shared the results with Pegasus as they were: severity-rated findings and a roadmap, for product to decide. The cards stayed the default; the matrix didn’t become the main view.
- Cards as the default
- Test mini comparisons inside the cards
- Matrix as an optional, secondary view
- Let people switch the default
- Cost of wrong-bundle choices on support
- Bundle purchase behaviour and revenue
LimitsExploratory study: 33 participants, so differences are directional, not statistically significant. The prototype was partly interactive, the matrix heatmap didn’t record, and there was no time pressure.
“I would rather learn early that our idea is wrong than ship it with confidence.”
An unvalidated design is a finding
Our matrix didn’t work for users. Sharing that openly with product turned it into a clearer roadmap, not a failure.
Define “correct” first
For a paid decision, accuracy is the primary metric. I set what “right” means before comparing layouts.
Confidence isn’t evidence
People felt surest on the layout where they were most often wrong. Measure what they do, not only what they feel.